
Labeled cardboard cartons sit on warehouse shelving, the stock a reorder point is meant to keep available.
A supplier might quote 25 days for production. A forwarder might quote 30 days port to port. Both numbers can be accurate and still leave you short, because the China reorder lead time that matters does not end when the goods leave the factory or when the vessel sails. It ends when inspected, received stock is available to sell.
The short answer: calculate a reorder point as average daily demand × measured replenishment lead time + safety stock, compare that trigger with on-hand plus on-order inventory rather than on-hand alone, then set the order quantity separately, because the supplier's MOQ may force it above your calculated need. The reorder point formula is published; the inputs are yours to measure, including door-to-door lead time, your own variability and the supplier's minimum.
The rest of this guide covers how to measure that window, choose a buffer method you can maintain, work the arithmetic, and log dates so the next calculation rests on your own history rather than a quote. Two questions run through the exercise. The trigger asks whether it is time to order. The order quantity asks how much to buy. Confuse them and you will reorder whenever stock feels low, which is how duplicate shipments and dead stock end up in the same quarter.
Measure lead time to the day the stock is usable, not the day it ships
Pick a start event and write it down: PO approval or release, supplier confirmation, deposit receipt, sample approval, or final artwork approval. Production lead time can be counted from different events, and mixing start points between orders gives you an average of unlike things. Use the same event every time (production progress guide). One buyer may count from deposit, another from sample sign-off; either can work. What does not work is a series that switches definition halfway through, because then the average describes nothing you can plan against.
End the clock at stock genuinely available for sale: after inspection or quality release, receiving and putaway, not when a carrier marks the shipment delivered. For imports, that window includes production, inland transport, port time, customs clearance, drayage and receiving, and an importer should also count port activity, container consolidation and inland transportation before ending it when inventory is genuinely available for demand (measured supplier lead-time guide).

Lead time ends when received stock is put away and available to sell, not when it leaves the factory or the vessel.
Agree the end event with your supplier. A factory may call goods finished when they come off the line, while you are expecting packed goods ready for collection, and packed goods can still be awaiting inspection or a decision on defects. Write separate dates for production completion, inspection, packing and pickup, and keep those four as checkpoints inside the lead-time log rather than as alternative finish lines. When one of them moves, it should show up as a longer measured lead time rather than as a redefinition of on time.
An ocean quote is a leg, not a delivery date. It normally describes only the international sea leg. For inventory planning, ask the forwarder for a realistic door-to-door lead time, not just a port-to-port transit time (US to China trade lane guide). The physical chain runs from the factory through Chinese inland transport, the export terminal, ocean carrier, US port, customs, drayage or rail, warehouse and final customer. Every link that sits outside the ocean leg belongs in your planning window.
Use ranges rather than a single promise. Port-to-port ocean transit from China to the US is often quoted at about two to five weeks, while door-to-door transit for a China-to-US ocean shipment is often around 30 to 40 days. An inland rail leg such as Los Angeles to Chicago can add roughly seven to ten days (sea freight guide). These are planning estimates, not guarantees. Port congestion, vessel schedules, blank sailings, customs processing, equipment availability and inland transport can all move the arrival date.
Cut-offs and customs stages carry real dates. For LCL, the consolidation warehouse cut-off falls earlier than the terminal gate cut-off. US-bound cargo requires the carrier's cargo declaration and the importer's first ISF elements 24 hours before loading, so a missing filing can become a missed sailing. Entry may be filed up to 15 calendar days after landing, and customs release is a separate stage after discharge. Deconsolidation at the destination adds warehouse days before LCL cargo becomes available (ocean transit guide).
Use the reorder point as a trigger, then choose the order size
The basic rule is reorder point = average daily demand × lead time in days + safety stock. Safety stock is the buffer against demand or lead time turning out worse than average (formula guide).
Try it with made-up numbers: at 40 units a day and a 15-day lead time, expected demand during the lead time is 600 units. Add, say, 77 units of safety stock and the trigger is 677 units. Those figures are examples, not a recommendation for your product. The trigger answers one yes-or-no question: will current and incoming stock cover expected demand while the replacement is on the way? It says nothing about how many units to buy.
Compare the trigger with inventory position, meaning on-hand plus on-order less backorders where applicable, not on-hand alone. Comparing only on-hand stock can prompt a duplicate order while a shipment is already in transit (inventory position guide). A 170-unit trigger, 120 units on hand and an open purchase order for 100 units due in five days is not necessarily a reorder situation; check whether the incoming supply arrives before the projected stockout. If it does, the trigger has already been served by a decision you made weeks ago.
Keep the trigger separate from purchase quantity. Preferred stock level, case pack and supplier MOQ affect how much you order, not the threshold itself. Keeping the two decisions separate makes the policy easier to audit: when numbers are questioned, you can point to a rule rather than a hunch. Recalculate when demand, lead time or service target changes materially, and at least quarterly for fast movers.
Choose a safety-stock method that fits your volume and data
Safety stock covers variability in demand or lead time; it is not a hidden correction for poor data. Demand variability, lead-time variability and the required service level all affect the amount of buffer you need.

Reserve inventory waits on warehouse racking; the safety-stock method you choose determines how much of this buffer you hold.
| Method | What it calculates | Better fit | Main caution |
|---|---|---|---|
| Simple days of supply | Average daily sales × chosen safety days | Stable, low-volume items with limited history | Experience-based and arbitrary |
| Average-max | (Maximum lead time × maximum sales) − (average lead time × average sales) | Low-volume items with simple history | One outlier inflates the buffer |
| Normal distribution, demand only | Z × demand standard deviation × √lead time | Lead time stable, demand variable | Ignores supply delays |
| Normal distribution, lead time only | Z × lead-time standard deviation × average demand | Demand steady, lead time uncertain | Rare in practice |
| Normal distribution, both independent | Z × √(lead time × demand variance + average demand squared × lead-time variance) | You have usable history for both | Assumes demand and lead time vary independently |
| Normal distribution, both dependent | Demand-only result + lead-time-only result | Delays and demand move together | Requires an even larger buffer |
The simplest method multiplies average daily sales by a chosen number of safety days. One worked example in the safety-stock formulas guide uses 100 units a day × 5 days = 500 pieces, giving a reorder point of 1,500 pieces. The same guide calls the method extremely basic, picked from experience rather than logic. That does not make it useless for a stable, low-volume item; it does make it hard to defend if demand or supply swings.
The average-max method uses the formula (maximum lead time × maximum sales) − (average lead time × average sales). The same guide's worked example returns 427 pieces, but one extreme lead-time or sales value in the history can produce a very high buffer. Even after excluding outliers, the method always covers the most extreme case, keeping stock high all year and raising inventory cost.
The normal-distribution methods start with a service factor Z. A 95% service level corresponds to 1.65 (safety-stock overview); a 90% target corresponds to 1.28 (safety-stock formulas guide). For demand-only variability, multiply Z by the demand standard deviation and the square root of lead time; the guide's demand-only example at a 90% target produced 194 pieces. For lead-time-only variability, multiply Z by the lead-time standard deviation and average demand; in the guide's example the result was lower than the demand-only case because lead-time variation there was small. For both uncertainties treated as independent, use Z × √(L × σd² + d² × σL²). Treating them as dependent means adding the demand-only and lead-time-only results, which needs even more buffer.
Selection guidance is conditional: low volumes point toward the average min/max method, higher volumes toward a normal-distribution method, trying demand-only or both-independent first depending on the data, and missing or unreliable lead-time data toward demand-only. Data quality matters more than the method. The normal-distribution method optimizes a cycle service rate, the frequency of stockout per replenishment cycle, not the fill rate or OTIF that many companies actually measure. It also works poorly with low sales volume, and real demand and lead-time distributions are asymmetric enough that extreme cases can be underestimated.
Notation varies too. One guide defines basic safety stock as Z-score × standard deviation of lead-time demand, and its worked example with a 50-unit standard deviation gives 82.5 units, about 83 units (safety-stock formula page). Other formulas use Z × σd × √L. Pick one version, write down what each symbol means, and test it against your own history. Do not treat any method as universally correct.
Work through one calculation and read its limits
Take one worked example to see the arithmetic. Suppose average demand is 40 units a day, door-to-door lead time averages 30 days, demand standard deviation is 12 units, lead-time standard deviation is 5 days, and you want 95% service (Z = 1.65). The independent-variation formula gives about 347 units of safety stock, and the reorder point becomes 40 × 30 + 347 = 1,547 units (worked example).
Read the components, not just the total. In that example the lead-time variability term is 40,000 against a demand term of 4,320, so lead-time variance dominates. Tighten the supplier's delivery so the lead-time standard deviation falls from 5 days to 2 days, and the same service level needs about 171 units of safety stock, 176 fewer units of buffer. Cutting supply variance can shrink inventory more than improving the forecast alone, which changes where a small buyer should spend effort: a tighter delivery window is often easier to win than a better forecast.
A second example shows what a reliable lead time does. With 40 units a day, a reliable 15-day lead time, demand standard deviation 12 and 95% service, safety stock is about 77 units and the trigger is 677 units. Again, these are illustrative numbers from a commercial guide, not China benchmarks or a recommendation for your product.
Use your own sales history. Exclude stockout days, because unavailable stock understates true demand, and exclude one-off spikes unless the policy is meant to cover them. Forecast error can be the more relevant variability measure if you have a forecast. Track actual lead time for the last 10 to 20 orders and calculate the average and standard deviation, then choose the service level by item economics. The reorder-point guide suggests a high-margin item that halts a production line may justify 99%, while a slow-moving accessory may justify 90%. The 90% and 95% examples here are illustrations, not a standard target for a small or mid-sized buyer.
Set the order quantity around the supplier's MOQ
MOQ is the fewest units a supplier will sell to one customer in one transaction, and it may be stated as a unit quantity or a dollar value (MOQ guide). It is a supplier constraint. EOQ is your internal order-size calculation based on demand and stock-holding cost. When your calculated order falls below the supplier's minimum, the sourcing plan has to adapt (MOQ vs EOQ).
Check what the minimum applies to: the order total, each style, each color, each size, packaging, full cartons, or a minimum order value. A per-color minimum can multiply across colors; one supplier-side example, 200 pieces per color × 4 colors = 800 pieces, is explicitly illustrative, not an industry standard. Meeting a color minimum does not necessarily satisfy a separate minimum for each size, and a quote may also hide a minimum order value or a full-carton requirement (China MOQ guide).
When the calculated order is below MOQ, the options include ordering more, negotiating, splitting a purchase with another buyer, arranging storage, or changing suppliers. These are options, not a universal ranking. If you cannot sell or use the MOQ in a reasonable timeframe, look for a lower-MOQ supplier or consider storage. Separate deliveries do not reduce the commitment: if the factory makes 300 now and holds the rest, confirm the total quantity, payment schedule, storage terms and ownership of unused packaging.
An inventory-threshold alert may start the review, but the resulting order still has to meet the supplier's MOQ. The MOQ constrains how much you buy; the trigger still comes from your own lead time and demand.
Log the dates and quantities that make the next calculation better
A reorder policy improves only when each replenishment leaves a usable record. For each comparable order, log the vendor, item, location, PO approval date, supplier confirmation date, expected receipt, actual receipt, inventory availability date, ordered quantity, partial receipt status, and any cancellation or expedite flag (lead-time measurement fields).
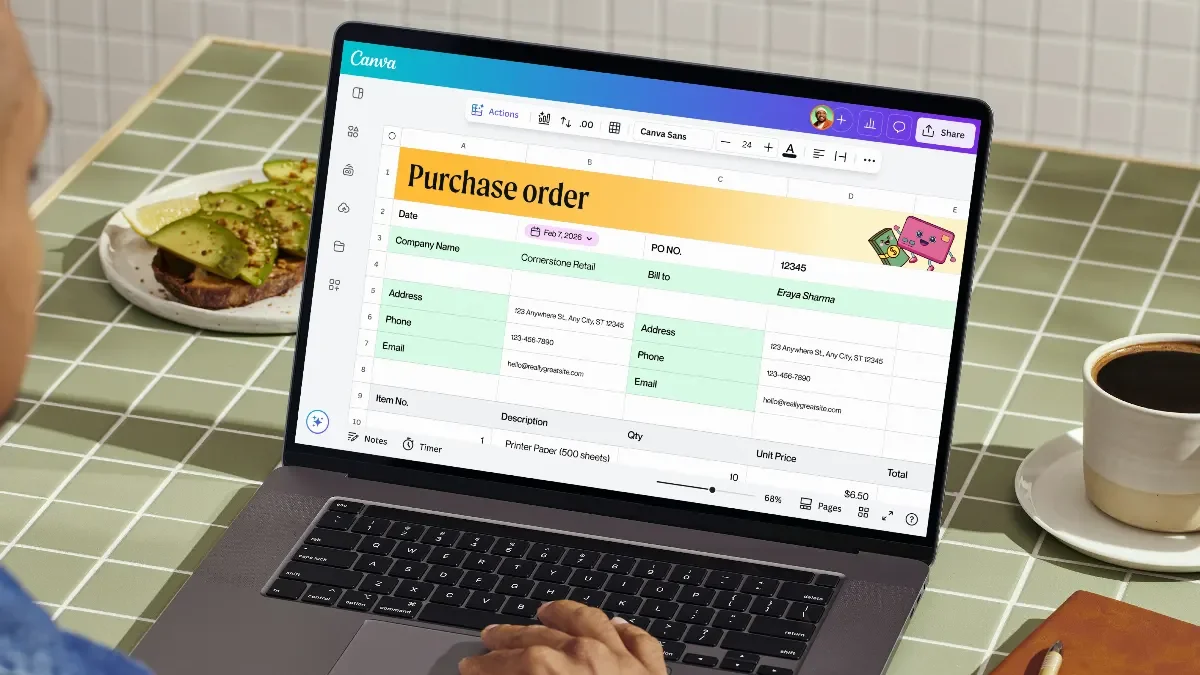
A purchase-order sheet on screen keeps the dates, quantities, and line values together so each order can be checked against the next reorder calculation.
Decide and document how partial receipts count. If 80% arrives on day 12 and the balance on day 25, usable lead time depends on whether the policy treats the first receipt as sufficient. For components that cannot support production until the full order arrives, the later date is the relevant one. Record the shipped quantity, stated reason and revised downstream date, not just a new promise. This one field decides whether your measured lead time is optimistic or realistic, so write the rule down before the first split shipment arrives.
Ask for one dated production update by PO, SKU and variant, and treat the reply as evidence for the next calculation rather than as reassurance. Use categories that do not double-count units (not started, in production, finished but unpacked, packed) so the totals reconcile against the ordered quantity. Record held or rejected units separately, and keep inspection or release status in separate fields, because a packed unit that has not been released has not reached your end event. What you want out of each update is the date a stage changed, attached to the order it belongs to; that is the raw material for the next observed lead time.
If a milestone slips, record the reason and the revised downstream dates, and file the slip against the observed lead time you will use in the next trigger calculation. Repeatedly moving the pickup date without evidence is a reason to verify the order on site before relying on another promise, and also a sign that the supplier's measured lead time has moved, not just this shipment. Either way, the slip belongs in a scheduled policy review, not in a private email thread.
Multi-supplier consolidation turns several supplier lead times into one arrival date, and the risk sits at the seams between them. Build a handoff record supplier by supplier instead of a general checklist: who supplies the receiving documents and which checks are included, the warehouse cut-off that applies to that supplier's cargo, the named person who reports delays or discrepancies, the approval path for extra charges, and who releases dispatch (consolidation guide). When one of those entries is blank, you have found the part of the chain that will surprise you. Ask the forwarder for ETD, ETA, customs release and delivery appointment; if a date is unknown, record it as unknown rather than filling the gap with a guess.
Review the trigger before peak season and after a slip
Put the trigger on a review schedule: at least quarterly for fast movers, and whenever demand, supplier, route, packaging, receiving or service target changes. Review it after repeated late receipts too. Track observed against planning lead time. Do not turn one exceptional delay into the permanent standard, but do not keep using a supplier quote that actual receipts contradict.
Plan around known pressure points. Peak shipping season typically runs from August to October, when lead times can lengthen because of increased shipping demand (peak-season guide). Chinese New Year moves demand forward and closes factories around the holiday. Blank sailings, rolled cargo, port congestion, weather and peak season can extend the cycle without appearing in a quoted transit time.
Seasonal timing is route-specific. One forwarder page calls January to March off-peak, while other guides stress pre-Chinese-New-Year shipping surges and factory closures. Confirm your supplier's and forwarder's dates rather than applying a universal calendar.
Keep an audit trail: old and new reorder point, effective date, demand basis, lead-time basis, safety-stock method and approving role. That turns the trigger into a governed business rule instead of an unexplained number in a spreadsheet.
What to do next
Pick one SKU. Pull the last ten purchase orders and measure the actual time from PO release to sellable stock. Calculate the trigger with a safety-stock method you can maintain, compare it with on-hand plus on-order inventory, and reconcile the order quantity with the supplier's MOQ. Write down the assumptions. Review the policy after the next shipment arrives, not after the next stockout.